The Camouflage Market
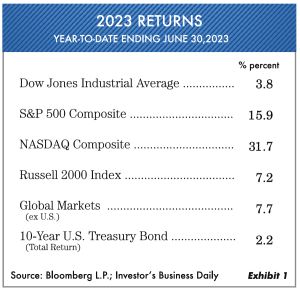
Now, at the midpoint of 2023, a completely different narrative from Wall Street has emerged from what they were saying at year-end 2022. It appears that four or five short-term swings in the market averages so far this year have caused an increasing number of investors to second-guess and get into speculative modes. In this market letter, we dissect the current market moves and “look under the hood” to see what is really happening. Exhibit 1 shows the investment returns of various popular market measurements for the first six months of 2023.
Why Camouflage?
If you look up the definition of camouflage it means “concealment that alters or obscures the appearance.” That is exactly what we have in the S&P 500 Composite average. Now everywhere we turn people are chatting about how well the market is doing this year. Notice Exhibit 2 showing the collective attribution of the top seven stocks and the return of the other 493 stocks included in the S&P 500.
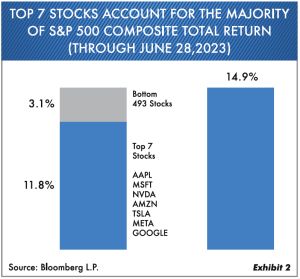
Today, most investors see the headlines and assume things are great. The concentration in these seven stocks camouflages the real market. In addition, in our opinion, the day-to-day players in these stocks are at best naïve. When we listen to investors talk about market moves, we should remind them that this group of seven stocks lost between -50% and -70% of their market value in 2022 … and yet, with the exception of Apple, they’re still not back to their 2022 highs. Is this a new bull market? It doesn’t look like it to us! This becomes the tortoise and the hare story where the best investors invest over the full cycle, not just the last three months. Until June 1, 2023, the S&P was almost equal to the same price two years earlier in June 2021. Then the one-day traders, coupled with greed, pushed the month of June to present levels.
Patience, Patience, Patience …
Everywhere today we read or hear in the Wall Street press that it’s a new bull market. If so, it would be the first time we had a new bull market with price-to-earnings multiples this high. This idea about markets making these big moves has been tested before in bubble markets. Notice Exhibit 3 showing the NASDAQ 100 decline in the 2000–2003 bear market.
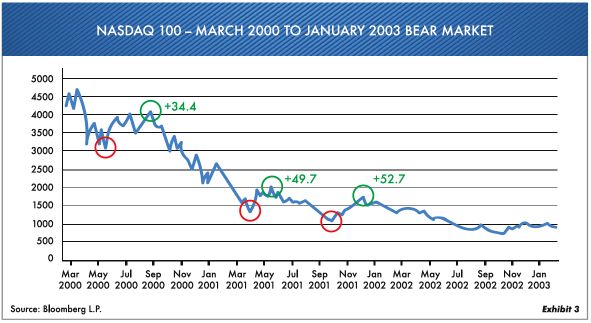
Notice there were three up moves in the averages that were each over +30%. Then after each of these moves, the market went to new lows. Meanwhile, during this extended bear market, the S&P 500 made two moves over +20% before going on to new lows. It pays to know a little history when deciding if you can’t miss out.
TINA to TIAA
TINA, meaning “There is no alternative,” was the phrase used for almost 12 years after 2009. Interest rates were at zero-bound, so investors could make very little money in bonds. After that … the last 15 months we believe that the new phrase should be TIAA: “There is an alternative.” Why? Because the yields on U.S. Treasury bills are higher now, thus providing attractive returns. Notice in Exhibit 4 the comparison of the S&P 500 earnings yield to the 90-day U.S. Treasury bill.
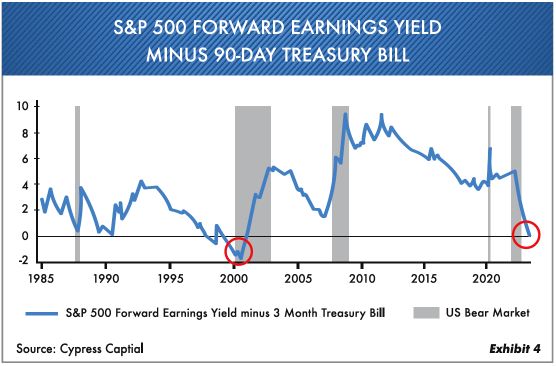
The earnings yield on the S&P is determined by dividing the earnings of the S&P by the price of the S&P. If the earnings yield is less than 5% and the U.S. Treasury bill is 5.25%, it changes things. What you can earn buying stocks versus what you can earn holding cash equivalents has fallen to the lowest level since the 2000–2002 dot-com bust. Cash is now a competing investment with the stock market, especially with above-average valuations.
What Would Change Our Minds?
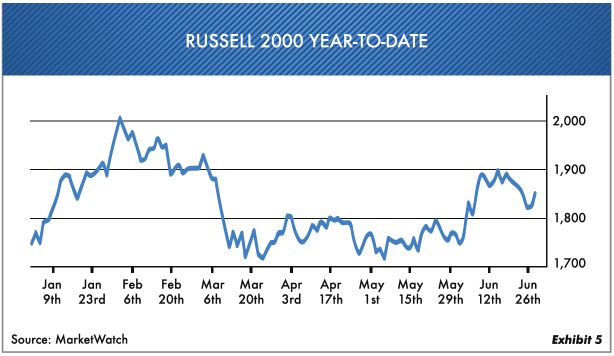
Evidence of a market low is presently very weak. We would need to see more broad participation from the stock market instead of just the big seven stocks. Notice Exhibit 5 showing the Russell 2000 index since January 1, 2023. There has been very little movement in those smaller public companies this year. That means the health of the latest market move is not that great. If the broad markets show signs of improvement, that would be a positive. In addition, we would like to see more market sectors providing good valuations.
A number of warning flags are still bothering us. The Federal Reserve’s inflation battle with higher rates is most likely not over. The Conference Board’s Leading Economic Indicator index has been down 14 months in a row, and this indicator has never fallen this far without a recession. Could it be the first? It could, but the evidence is still there. Couple that with the inverted-yield curve, and there is still a lot of uncertainty. The commercial real-estate market and, to a degree, the residential market are both under pressure. If a number of these things reverse, we would feel better about the long-term outlook for the broader market. A number of technical indicators have improved, but not enough for us to make major strategy changes.
Where We Are Now …
This bear market has gone on for 18 months, and just about everyone is begging the Federal Reserve to step in and save the day with lower interest rates. In our opinion, the Fed can’t fight inflation and support the stock market at the same time. This unhealthy situation all came from one of the biggest bubbles of all time, and it doesn’t just go “poof” and disappear. The basically “free money” created too much speculation to make it this easy to normalize everything. This is a time to keep your common-sense hat on and be aware of the big picture. We are seeing far too many people getting into speculative trading that are not qualified. We’re reminded of day traders in 1999. In the meantime, we’re earning good returns on short-term U.S. Treasury bills—and at the same time keeping our eyes open for changes.
As always, we will be vigilant with your investments. We hope you have an enjoyable and safe summer.
Ted Oakley
Bob Walsh
“Wall Street is the only place that people ride to in a Rolls-Royce to get advice from those who take the subway.”
-Warren Buffet-
“Periodically, financial markets will become divorced from reality.”
-Warren Buffet-
The opinions referenced are as of the date of publication and are subject to change due to changes in the market or economic conditions and may not necessarily come to pass. Any opinions, projections, or forward-looking statements expressed herein are solely those of the author, may differ from the views or opinions expressed by other areas of the firm and are only for general informational purposes as of the date indicated. The material contained herein has been prepared from sources and data we believe to be reliable but we make no guarantee as to its accuracy or completeness. This material is not intended to be relied upon as specific legal or tax advice or investment recommendations for any individual as the information provided does not take into account the specific objectives, financial situation, or particular needs of any specific person.
GET YOUR COMPLIMENTARY COPY OF TED OAKLEY’S BOOK
Your Money Mentality
Order Below
