Oxbow Advisors – July 2022 Market Updates
Oxbow Advisors – July 2022 Market Updates
Nowhere to Hide
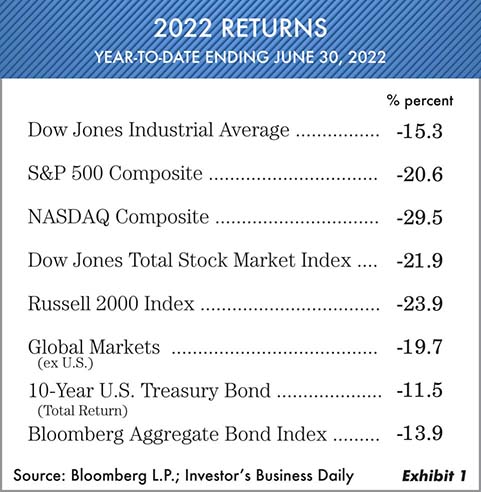
The first half of 2022 has been a very difficult investment environment. The stock market downtrend that began in the first quarter of this year continued in the second quarter despite three short counter trend rallies that failed to change the market’s primary downward direction. The second quarter of 2022 was a particularly tough period. It has been a long, long time since every asset class was negative at the same time. In this issue we hope to delve into some of the reasons for this and also project future outcomes. But first, notice Exhibit 1 with year-to-date returns on various major market averages.
The prolonged stock market weakness from April 2022 into mid-May of 2022 got everyone’s attention as the selloff was not like most past downturns. This decline was very methodical and organized so that most investors haven’t panicked even though they have encountered heavy losses. Growth funds in particular have been hit the hardest. As you can seein Exhibit 2, the Investor’s Business Daily Mutual Fund Index:

Notice at the top of the chart all the big name mutual funds included in this index. The average IBD (Investor’s Business Daily) fund is down -28% as of June 24 of this year, and there are a number of other funds that are doing even worse. This is the reason we at Oxbow keep espousing that investors have and maintain a balance in their investments. We still believe that a portion of investments should always be in a safety zone. Wall Street has pushed the “60% stock 40% bond” investment mix mantra so long that they have gone to sleep. But this ratio of holdings in 2022 has had one of its worst performance records ever, even worse than in the 2008 bear market. Exhibit 3 shows the 2022 year-to-date quarterly returns.

The Fastest Move Ever …
Bond prices got pummeled in the second quarter of 2022 as the Federal Reserve decided to “play hard ball” with interest rate increases. This is all-too typical of Fed actions as they pushed so much liquidity into the system during 2020-2021. The recent action caught just about everyone off guard as far as the severity of the move up in rates. Exhibit 4 shows the percentage change of interest rate increases in just one year. These are not typos but huge increases—in fact, the fastest and most severe ever!

Just like we at Oxbow have been saying for the past two years or more. This Federal Reserve is one of the worst ever–with little regard for the extremes they place upon the economy and the country. As usual, they always seem to be looking backward. This is what you get when ordinary people aren’t involved in the process. This whole group of Fed people have spent their lives gathering data but they seem to have forgotten that the real economy is on Main Street. They have now abandoned the full employment idea and are totally concentrating on inflation. They are saying that their commitment to getting inflation down is at the top of their list. If that is in fact the case, we likely have some tougher economic problems ahead!
Real Estate… The Achilles Heel …
If there is one major investment area that appears to have some trouble ahead, though not yet experienced, it is real estate. The Fed lowered rates so much that the speculative activity in real estate is off the charts. Our friends at InvesTech Research have provided two very interesting graphs. Exhibit 5 shows the spread between the Consumer Price Index and housing prices and what happened in 2006-2008 after the 2005 housing bubble occurred. Currently real estate prices are even more overextended than the stock market.

In addition, there is a huge increase in down payments and mortgage payments in just four years (2018-2022). A 50% increase in the required down payment for a home along with a 70% increase in the mortgage payments. Exhibit 6 shows the dramatic increase.

We are already starting to see a slowdown in the real estate market across the U.S. There’s still some demand that was already in the queue, but new buys are coming under pressure. As we have often said, the real estate market break comes later—after the stock market has broken. The end of this real estate blow off could be really tough. People have speculated on every kind of residential real estate so much that many will be trapped in a house that is too expensive and can’t be sold, not to mention mortgage rates now doubling. The immobility problem for young people will be devastating unless interest rates can come back down again. Remember that housing is almost one fifth of GDP (Gross Domestic Product) in this country.
Nothing From Nothing Leaves Nothing …
Crypto reminds us of the Billy Preston song “Nothing From Nothing.” There is a line in there that says, “That minus is too low to see.” Well here we are in this era of owning things that have absolutely no redeeming investment qualities. Yes, a few will get through and even usher in a new digital world but most will likely continue to crater. Among all 10,000 cryptocurrencies and NFTs (non-fungible tokens) there have been some major losses in recent weeks in particular. Notice Exhibit 7 showing 20 of the top trading crypto declines.

The average decline of the above cryptocurrencies in 2022 to date is -72.89%. Sadly, a large number of people had virtually all their saved investments in them. It’s estimated that the hardest hit will be individuals under 40 years of age who bought in. Their days of video games got transposed into crypto—not realizing this is the real world.
What Can We Do Now?
This is the question on most investors’ minds. Hopefully you have had some liquidity as we at Oxbow Advisors have been recommending for some two years now. Investors have to remember that one cannot completely side step a bear market. The objective is to control risk. If a bear market were to decline -50%, then you have to have a 100% gain just to break even. If you were able to keep that at a -20% decline you need only 25% to break even again. There’s a lot of difference in these outcomes. At Oxbow we know we can’t be a market timer and miss the down markets, but we can work to mitigate risk. To do so… we currently are starting to get some really nice returns on 1-2 year Treasury notes.
Along the way there are going to be intermittent moves higher but they seldom last. Try not to get caught up in the idea that this is your last chance to catch the bottom. Because no one can do that. At Oxbow, if we see that things are improving or we should commit funds that will happen. But for now we are still cautious and will do our best to guide you through this.
Hopefully you will have a great summer and just be grateful for all the good things we enjoy.
Ted Oakley
Bob Walsh
“When it gets too easy to make money, get out of the way.”
–Roger Lipton
A token (NFT) of Jack Dorsey’s first Twitter tweet sold in March 2021 for $2.9 million. Earlier this year the owner, Sina Estavi, put it up for auction. He received no bids over $14,000.
–Wall Street Journal
Ted Oakley’s New Book Now Available
Order Below
Your Money Mentality
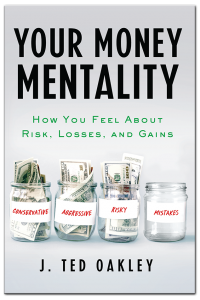
Ted Oakley’s new book Your Money Mentality explains how investing is not linear and that successful investing sometimes goes against conventional wisdom. From Oakley’s years of experience, he walks investors through the highs and lows of the market to help them determine their own money mentality.
Please fill out the form below for your complimentary book.
Ted Oakley’s New Book Now Available
Order Below
Your Money Mentality