Speculation Is Back … But So Is Inflation
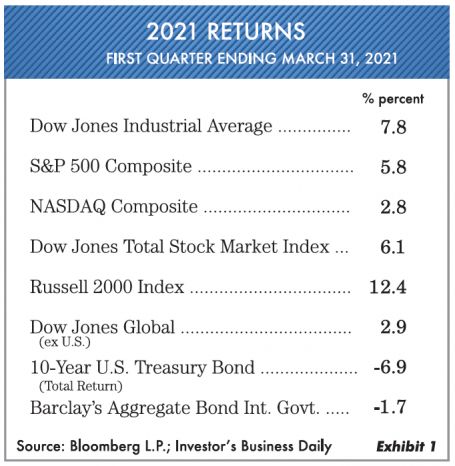
The first three months of the new year brought a basically flat January, an up February, and then an up-and-down March in the stock market’s movement. The end result was somewhat positive after the government stimulus payments and vaccines made people think “Happy days are here again.” Something that noticeably changed could be seen, as the bond market was negative. Inflation is on the rise, and we have to keep that in mind. Returns of various major market averages for the first quarter ending March 31, 2021, are shown in Exhibit 1.
In this Market Comments we hope to give you insight on where the stock-and-bond markets are in this crazy, unusual environment. Unfortunately, it appears that most people think the overall market is just snapping back to look like it did in years past. They likely will be disappointed by the outcome. Namely, $30 trillion in debt and moving higher. KRWG Public Media estimates that if you stacked one trillion dollar bills on top of each other it would be 67,866 miles high. Even a trillion in debt is hard to fathom. Our comments first will focus on the stock market and then take a hard look at the bond market. In short, financial asset returns are probably not what people are expecting in the future.
Major bull markets are different from bear markets in that they are usually longer in duration on the upside and shorter on the downside. What this does is produce a number of years when the markets are overvalued and then go into a speculative phase. This is where we have been residing for some time. Exhibit 2 shows the trailing price-to-earnings ratios of the S&P 500 from 1990 to the present.
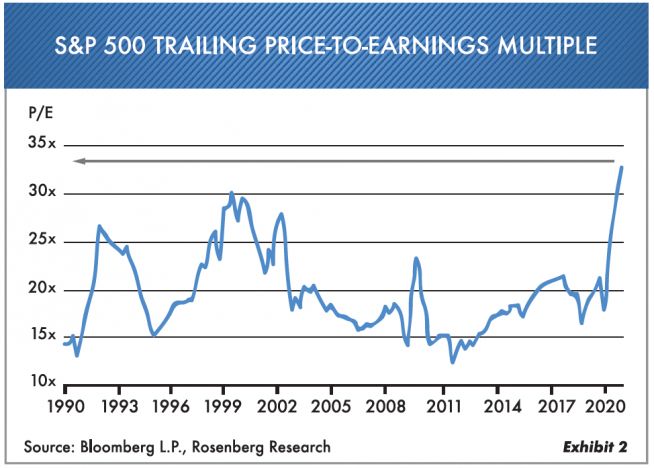
Obviously, the markets by this measure are more expensive than even the 2000 tech bubble. In addition to this, we have so many other areas that go sight unseen. For instance, 35% of the Russell 2000 stocks are losing money, 12% of the S&P 500 companies are selling at 10 times revenue, and small individual traders are gambling at every level. Wall Street continues to do its part by bringing the worst investment in decades in the form of SPACs (special purpose acquisition company) and low-grade debt. This low-interest-rate environment has caused investors to throw caution to the wind and bid up almost all prices. There is a stage in virtually every market where conservative investors “throw in the towel” as they decide that they too have to get back on the stock market bandwagon. We understand … it’s hard to see your friends making lots of money. Notice in Exhibit 3 how this has affected the pricing of stocks based upon revenue.
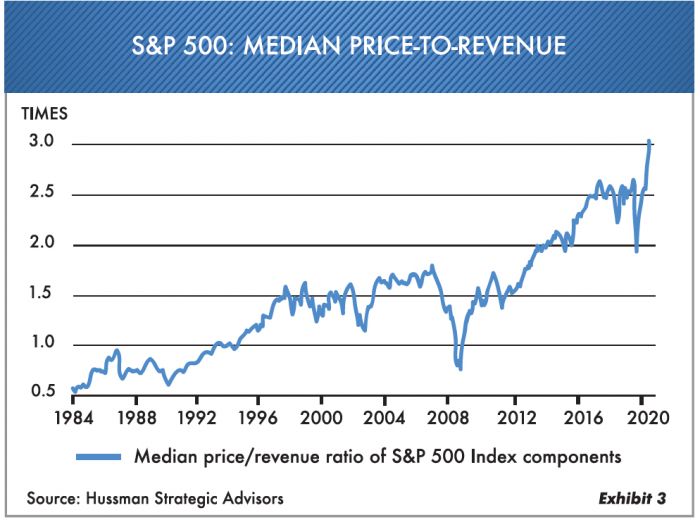
When you pay three times revenue for any business, your optimism is “off the charts.” Consider that if a company has a 10–12% profit margin and you pay 3.2 times revenue … your time horizon for a return will be longer than at any other time in recent history. Today’s wealth managers and financial advisors are primarily asset allocators. New investors are unfortunately looking backward at what returns have been in this super-long, strong market propelled primarily by the Federal Reserve. The bad markets of 2000 and 2008 are a distant memory. In our January 2000 Market Comments, we almost exactly called the market high. This time around it has been harder because the money from the government just keeps coming. Unlike any other time, investors are likely to completely rely on the Federal Reserve and low interest rates, perhaps indefinitely. However, this in reality may be changing, which is why it pays to look closer at the interest-rate environment.
There Is No 40%
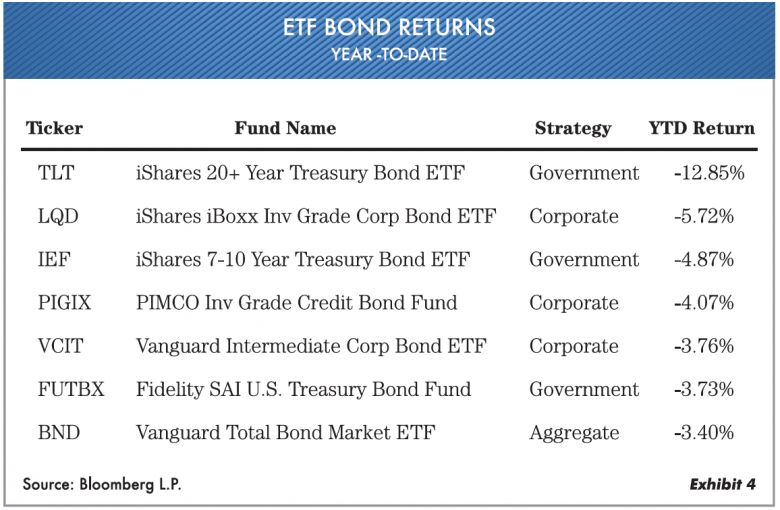
In our last quarterly Market Update video, we made the statement that “There is no 40%,” referring to the fact that bonds were yielding so low that they could not benefit the holders. Wall Street has loved the 60% stock-40% bond portfolio for the last 10 years. This popular asset allocation, as we discussed, only had to slot money into each category. But now, yields are terrible, and that allocation probably will no longer work. Notice in Exhibit 4 the year-to-date returns for various ETF (exchange-traded fund) bond funds. We doubt most investors are expecting this.
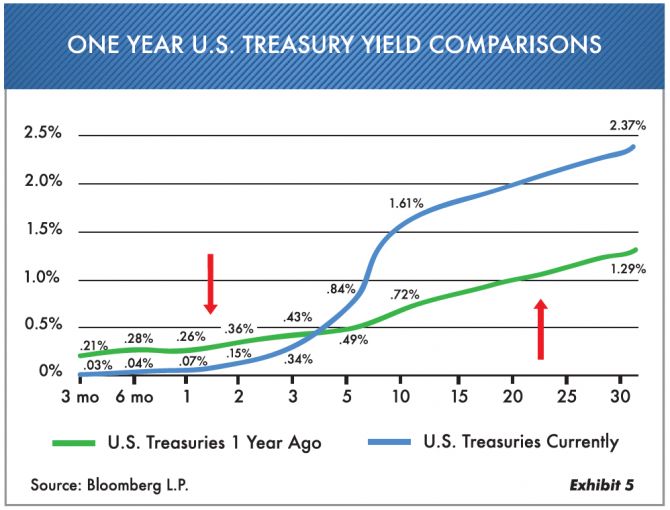
Why is all this happening? The Federal Reserve, in all their so-called wisdom, is continuing to buy $120 billion of bonds each month, which is keeping short-term rates very low. As an example, one-month U.S. Treasury bonds currently provides a negative yield, and the six-month U.S. Treasury bond is a paltry 0.002 (almost nonexistent). Notice in Exhibit 5 how much rates have changed in just one year. The short rates (three years or less) have dropped, and the longer rates have increased because the Federal Reserve cannot control long-term rates (it can only be done by yield-curve control, which is dangerous). The Fed thinks it can walk a fine line here between inflation now coming back and keeping the money flowing short term. We doubt that this is possible, but we’ll wait and see.
